Abstract
The “Stage 3 Expansion” of the Kooragang Coal Terminal was a major industrial project which boosted the coal exporting capacity of Newcastle, making the terminal the largest coal handling facility in the world. Port Waratah Coal Services appointed Bechtel Australia in July 1999 to design and construct the expansion, which was completed early 2002.
Douglas Partners Pty Ltd provided geotechnical, environmental and earthworks testing services for design and construction purposes. The site is underlain by soft estuarine sediments, which are susceptible to settlement via consolidation and creep. The investigation included extensive use of cone penetration tests (including standard friction cone, piezocone and seismic cone) to profile the subsurface conditions and provide data for settlement estimates.
A feature of the geotechnical design was the use of a two-stage 9 metre high preload to consolidate and improve ground conditions prior to construction of the 1.2 km long coal pad and reclaimer berm. The preload was extensively monitored and the geotechnical instrumentation included settlement monitoring plates, vibrating wire piezometers, inclinometers, earth pressure cells and one extensometer installed to the bedrock at approximately 50 metres depth.
This paper describes the geotechnical investigation, preload design, settlement predictions and the monitoring results, comparing actual to predicted performance.
1. Introduction
The Stage 3 Expansion of the Kooragang Coal Terminal was a $330 million project which boosted the coal exporting capacity of the terminal to 89 million tonnes per year. The Kooragang Coal Terminal, operated by Port Waratah Coal Services Limited, is located at Kooragang Island, in the port of Newcastle, NSW.
Kooragang Island was formed through the extensive reclamation of small islands, shallows and channels and contains deep estuarine sediments which are susceptible to settlement via consolidation and creep.
The site contains the world’s largest coal handling operation. Coal is transported primarily by rail from Hunter Valley mines, emptied in the receival (dump) station and conveyed to rail mounted stackers which place coal in designated stockpile areas. Coal is then reclaimed from the stockpiles by bucket wheel reclaimers and transported via conveyors to the shiploaders for export.
Port Waratah Coal Services engaged Bechtel Australia Pty Ltd to undertake engineering, procurement and construction management for the Stage 3 Expansion, which included a third stacking and receival conveying stream, rail receival (dump) station, stockpile pad and reclaimer, shiploading conveying stream and new shiploader.
Due to the presence of deep, soft estuarine sediments, ground improvement by way of staged preloading was undertaken to reduce post construction settlements prior to the construction of the coal pad and reclaimer berm.
2. Geotechnical Investigation
An extensive geotechnical investigation program was undertaken to assess site conditions (Douglas Partners 2000). The site was particularly suited to cone penetration testing (CPT), due to the presence of soft estuarine sediments. The investigation comprised a combination of CPT, piezocone tests, pore pressure dissipation tests, seismic CPT, conventional boreholes and jetted bores, shear vane tests and test pits. A range of laboratory tests including oedometer consolidation, triaxial, permeability, Atterberg limits, sieve analysis and hydrometer tests were also undertaken to characterize soil conditions.
The interpreted geotechnical soil profile is shown in Table 1 in a simplified form:

The groundwater regime included two aquifers: an upper unconfined aquifer in the sand fill, and a lower semi-confined aquifer beneath the upper silty clay.
The main geotechnical issue at the site was the presence of the upper clay layer with respect to consolidation and creep. The presence of the dual aquifer system also had implications for deep excavation works.
Engineering parameters estimated from CPT data were processed together with the results of laboratory testing to produce continuous profiles of parameters such as shear strength, over consolidation ratio, coefficient of volume change, drained modulus and friction angle. The data was entered into a purpose written spreadsheet which provided the projected time-settlement behaviour at each CPT location, based on one-dimensional consolidation theory. The spreadsheet was first “calibrated” against alternative estimates based on laboratory tests (compression indices) and a two-dimensional FLAC analysis.
Settlement analysis indicated that settlements of up to 700mm were likely over the nominated design period unless ground improvement was carried out at the proposed berm and coal stockpile site. Considerable costs are incurred when re-levelling of stacker and reclaimer rails is required as a result of excessive settlements. The nominated design period was 17 years, allowing for three re-levelling episodes over a design life of 50 years.
The objective of geotechnical design was to design a ground improvement system to limit post construction settlements over the 17 year period to 200mm beneath the reclaimer berm, and 300mm beneath the coal pad. At the same time, the existing berm and coal Stacker, immediately adjacent to the new stockyard, had to remain in service during the entire construction process without disruption.
3. Preload Design
A number of options for ground improvement were considered to limit post construction settlements. Preloading was assessed to be the most feasible and economic option to meet the performance requirements. Settlement analysis indicated that a total preload height of about 9 m (about 165 kPa applied pressure) would be required to achieve the design objectives over a preload period of less than 12 months. The height of preload was also influenced by the availability of preload material, and the staging of construction works.
Stability analysis indicated that slope failure would occur if the full height of preload was placed in a single stage due to the upper soft to firm clays. A two stage preload system was therefore designed to address both settlement and stability issues during construction. It was estimated that each stage would take between 1 month and 6 months to complete 90% primary consolidation, depending on the thickness of the upper clay. The design included a 10 m wide bench (‘stability berm’) between the lower and upper stage of preload to address stability issues.
The 4 m high Stage 1 preload was initially placed and monitored to achieve sufficient strength gain in the upper clays to allow the placement of Stage 2 (an additional 5 m) with a low risk of slope failure. As the preload was a temporary slope, the design factor of safety generally adopted was 1.2, although one section was designed at about 1.1 in order to avoid widening the stability berm and increasing the amount of preload material required (a risk accepted by the client and controlled by close monitoring).
The requirements for a two stage preload increased the need for accurate and timely monitoring of the preload progress, in order to ensure that the construction program remained on schedule. A comprehensive array of geotechnical instruments was installed following initial levelling of the site and prior to placing the first stage of preload. The types and numbers of instruments installed are shown in Table 2.

A diagram representing the preload process from the initial ground conditions to the operating coal stockyard, is shown in Figure 1. The instrument layout is schematic only, and they were actually installed on a regular grid

A diagram representing the preload process from the initial ground conditions to the operating coal stockyard, is shown in Figure 1. The instrument layout is schematic only, and they were actually installed on a regular grid
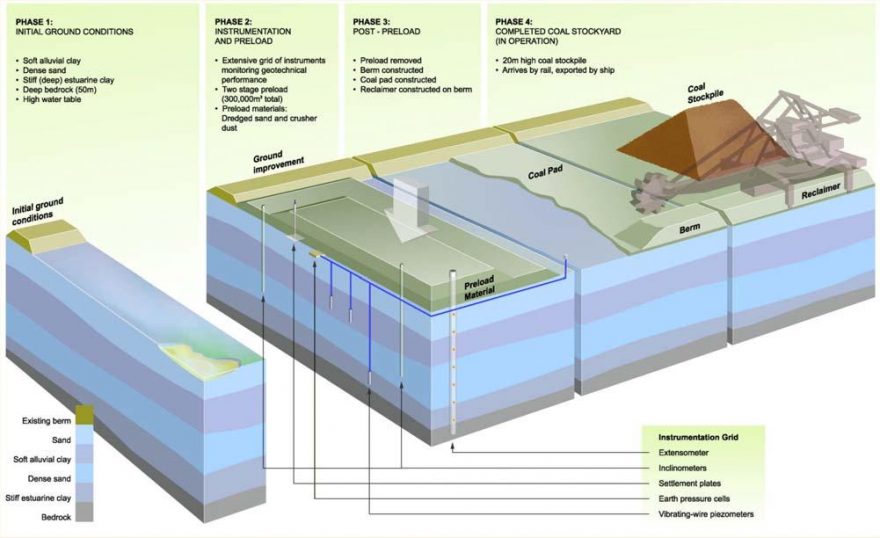
Figure 1: Diagrammatic Illustration of Preload Process
4. Monitoring Results
4.1 General
The preload monitoring program comprised weekly readings of all instruments for the initial phase of consolidation, reducing to fortnightly in the areas of thicker clay (where consolidation would take a number of months). When the monitoring indicated that primary consolidation of the clay was substantially complete beneath the Stage 1 preload, a further series of CPTs were carried out to assess the strength gain in the clays. Following confirmation of the strength gain, Stage 2 preload was added (making a total preload height of 9 m).
The above process was repeated for Stage 2 preload, including CPTs to confirm the final strength gain. The preload material could then be removed and the Reclaimer berm constructed. The preload was actually carried out in sections of about 300 m to 400 m length in order to re-use preload material and minimise the excess material at completion. Berm construction proceeded in the completed sections while the next section was under preload. The 2000 t Reclaimer machine was then constructed on the first completed section of berm.
Descriptions each type of monitoring instrument and examples of the results obtained are presented in the following sections.
4.2 Settlement Monitoring Plate
The settlement monitoring plates (SMP) comprised a 500mm square steel base plate with 32mm diameter steel risers, added in sections as the height of preload was increased. The risers were encased within a protective PVC pipe.
Survey levels were taken by the project surveyors on the base plates prior to any preload being placed, and then on the top of the steel risers at regular time intervals during and following placement of the preload. Great care was required on the part of the earthmoving contractor to avoid disturbing the SMP risers, and a low attrition rate was achieved (inevitably however some risers were damaged). A typical SMP plot is presented in Figure 2.
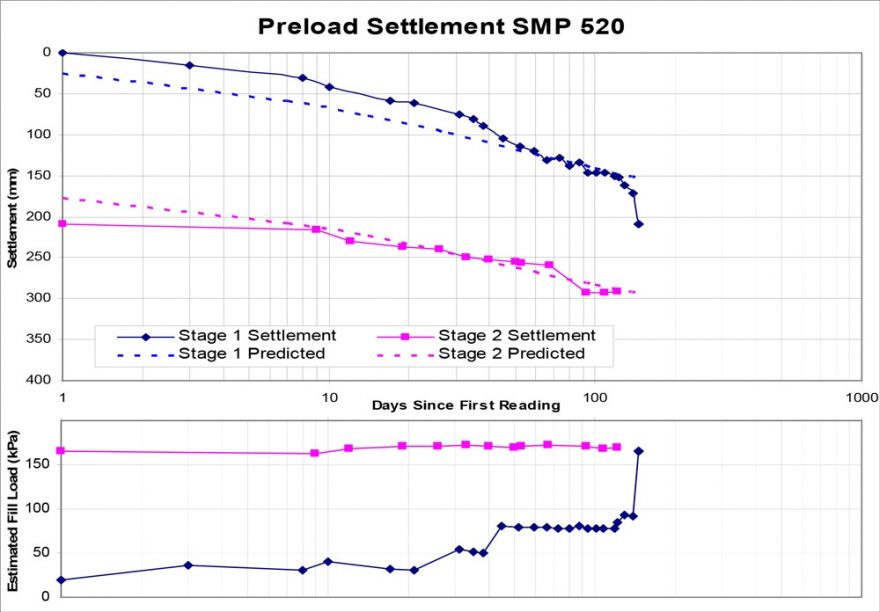
Figure 2: Typical Settlement Monitoring Plate Record
The predicted time-settlement behaviour (shown dotted in Figure 2) assumed that the load was applied quickly, however in practice it took time to build the preload up to design levels. The lower plot shows the estimated fill load for each stage of loading, based on the recorded fill height and fill unit weight. Most SMP installations recorded an acceptable agreement between predicted and measured performance, in terms of both magnitude and rate of settlement.
The ‘jump’ in the plots at the end of Stage 1 represents the progression to Stage 2, which is then plotted as a new phase of consolidation. It is further noted that very few monitoring locations exhibited a classical one-dimensional shape of the consolidation curve. This was mainly due to the fact that the upper clay layer was generally composed of two or three layers separated by sandy layers, and the deeper stiff clay layer also contributed to settlement; these layers consolidated at differing rates. Along the edges of the preload there was also some plastic deformation in the form of lateral squeezing (see discussion on inclinometers in Section 4.3).
4.2 Piezometers
The vibrating wire piezometers were installed beneath the preload within the upper soft to firm clay layer to monitor pore water pressures. One piezometer was also installed within the deep stiff clay layer. Their purpose was to monitor the dissipation of excess pore pressure, and augment the SMP data to assist in determining when preload could be removed. The piezometers used had a rated pressure of 350 kPa and a maximum pressure of 525 kPa.
A typical piezometer plot is presented in Figure 3 and the deep clay piezometer is shown in Figure 4. The piezometer plot shows the recorded pore pressure and estimated hydrostatic pressure, with the difference being the excess pore pressure, plotted against root-time. In this particular case, the second stage of preload was added in two separate load increments following the initial dissipation of pore pressure, in order to reduce the risk of instability.
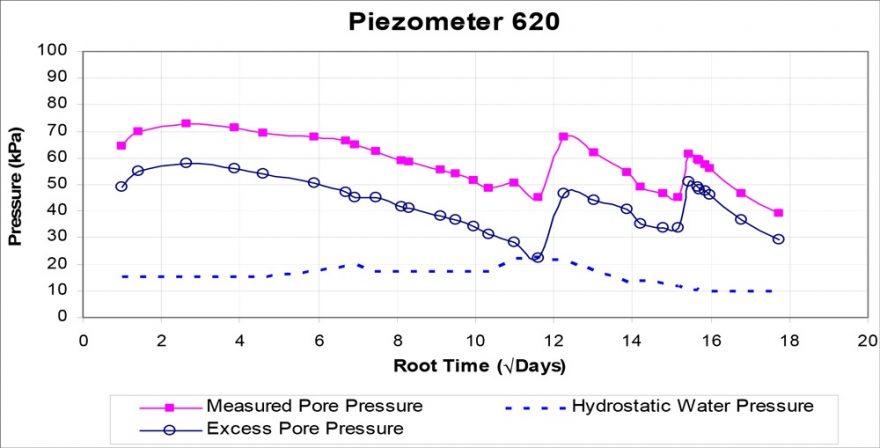
Figure 3: Typical Piezometer Plot – Upper Soft Clay
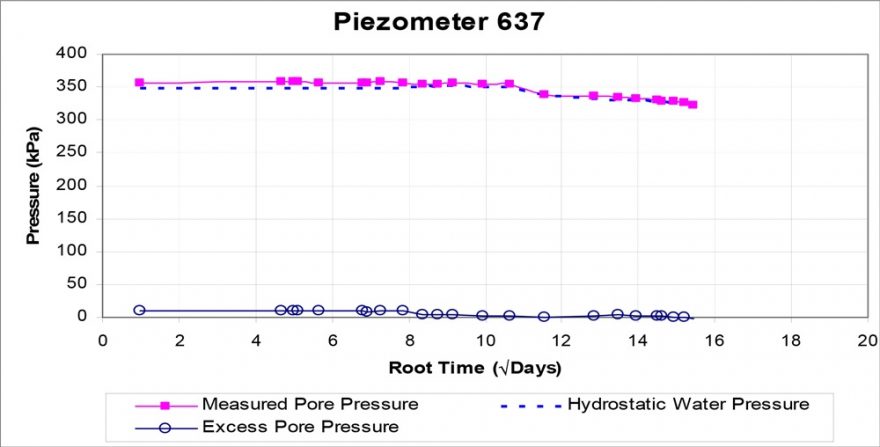
Figure 5: Typical Inclinometer Plot
Figure 5 also shows the ground level and location of the upper soft clay layer, as well as the predicted deflection, as determined by a FLAC analysis prior to commencing preloading operations. The total lateral deformation and rate of deformation was used together with the settlement plate and piezometer monitoring results to confirm the stability of the preload embankment and determine when the Stage 2 preload could be placed.
Not all inclinometer records matched the predicted lateral movement: most deformed less than the predicted amount, while a few moved more than predicted. Those which exceeded predictions were associated with the section of preload where the factor of safety was rather low. Lateral deflections in the range 450 mm to 600 mm were recorded in four inclinometers in this area. An example of this is Inclinometer 711 which is shown in Figure 6.
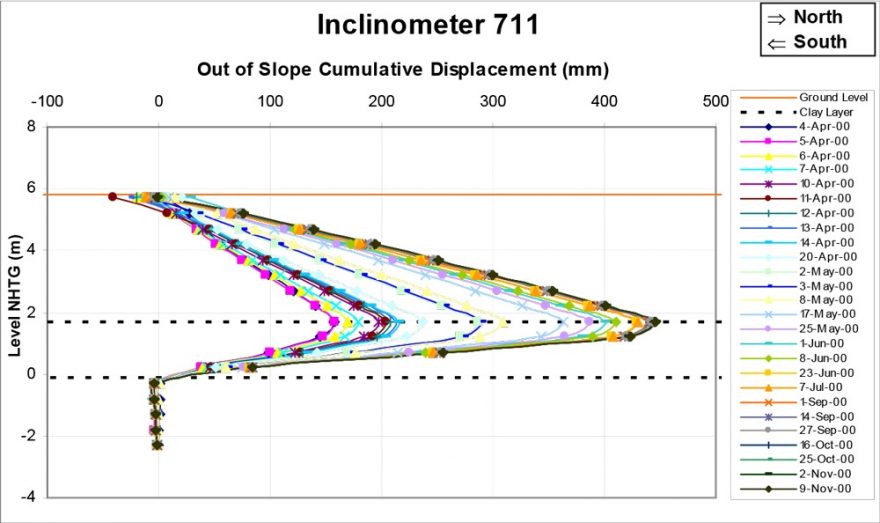
Figure 6: Lateral Deflection in Area of Low Stability
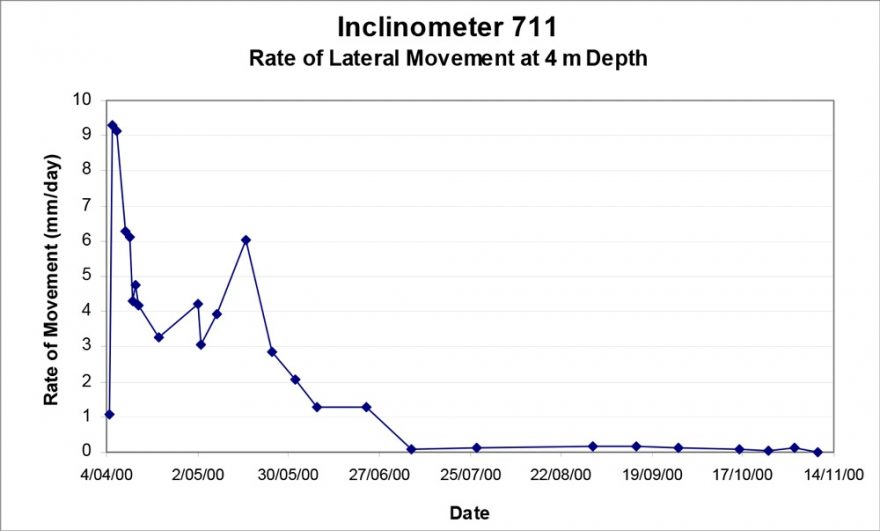
The results depicted in Figures 6 & 7 indicate significant plastic deformation (squeezing) of the clay layer occurred in the area which had a low factor of safety against failure, however a failure mechanism did not fully develop for the whole profile and the preload remained intact. Failure was avoided by delaying, and then staging, the application of the Stage 2 preload. Eventually there was sufficient strength gain in the clay to accommodate the full preload.
4.4 Extensometer
An extensometer was installed to bedrock (47 m depth) at one location beneath the preload to measure the contribution of settlement in each layer to the total settlement, and in particular the deep stiff clay layer. The extensometer included 13 target magnets at various depths and a datum magnet set in the bedrock at the base. The measurements were taken over a seven month period before the extensometer had to be discontinued to make way for construction. The time- settlement plots for each magnet are too voluminous to present here, however a summary of the final settlement of each magnet is present in Table 3.

The results indicated that the majority of settlement occurred in the upper soft clay layer as expected, with 25 mm recoded for the deep clay layer which was about 13 m thick. Unfortunately the second stage of preload had only been in place six weeks when the monitoring was discontinued.
4.5 Earth Pressure Cells
A total of four earth pressure cells were installed beneath the preload to confirm the magnitude of the load applied by the preload. The pressure cells were vibrating wire type with a maximum pressure of 300 kPa. Two types of fill material were used as preload: dredged sand (unit weight ≈ 18 kN/m3), and Crusher Dust (unit weight ≈ 20 kN/m3). The type of fill and the corresponding density were taken into consideration when determining the estimated fill load for settlement, piezometer and extensometer monitoring.
Figure 8 shows the results obtained from one of the earth pressure cells. The initial readings, as the preload was being built up, were relatively low and the back-figured unit weight was inaccurate. However, once the fill load exceeded about 100 kPa, the accuracy improved and appeared to provide a reliable estimate of the fill unit weight.
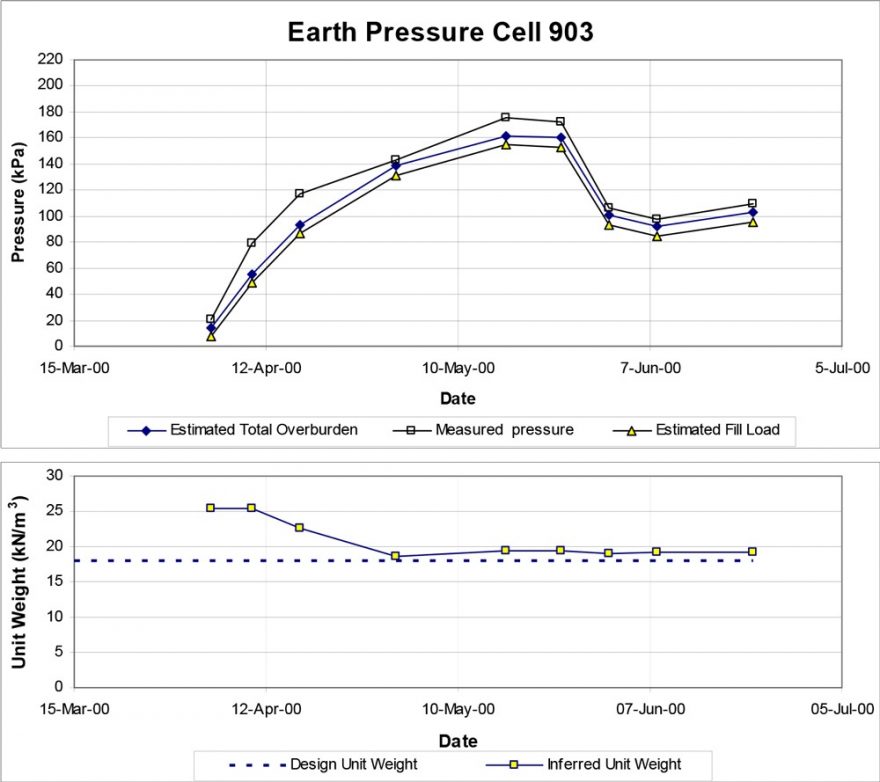
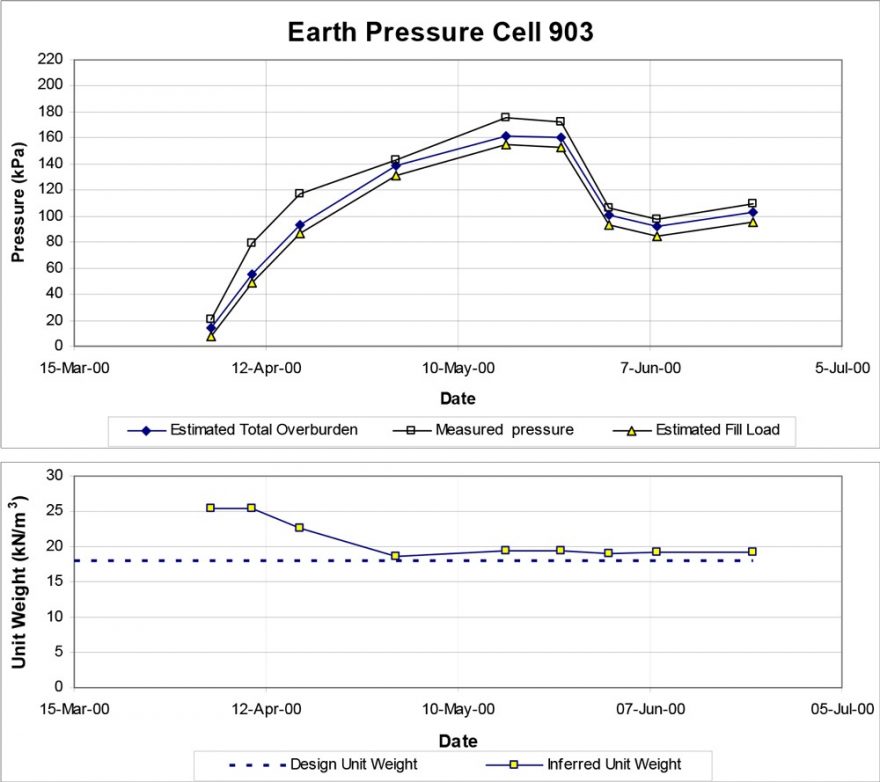
Figure 8: Earth Pressure Cell Record and Back-figured Unit Weight
The back-figured unit weight averaged 19 kN/m3, which was satisfactory as preload design had been based on 18 kN/3 for the sand fill.
4.6 Strength Gain Assessment
A total of 90 CPT’s were carried out at the end of Stage 1 and Stage 2 preload. A sufficient gain in strength of the upper clay was necessary to ensure adequate bearing capacity, slope stability and confirm that long term settlement predictions would be valid.
Prior to preloading, the average shear strength of the upper soft clay strata was measured at about 15 kPa. Early in the project, the report on the proposed preloading predicted that the shear strength of the clay would increase to an average 30 kPa after Stage 1 preload, and to an average of 50 kPa after Stage 2 preload.
Figure 9 below shows the results of three CPTs carried out at close to the same location before preload (i.e. initial investigation), after Stage 1 and after Stage 2. The profile of undrained shear strength has been calculated and plotted against reduced level. These plots show a 1.5 m thick clay layer underlain by three thinner layers. The shear strength before preloading ranges from 10 kPa to 25 kPa. After Stage 1 preload the clay strength has increased to an average of about 35 kPa, and after Stage 2 preload the clay strength has increased to an average of about 55 kPa. A distinct thinning of the layers is also apparent from the plots.
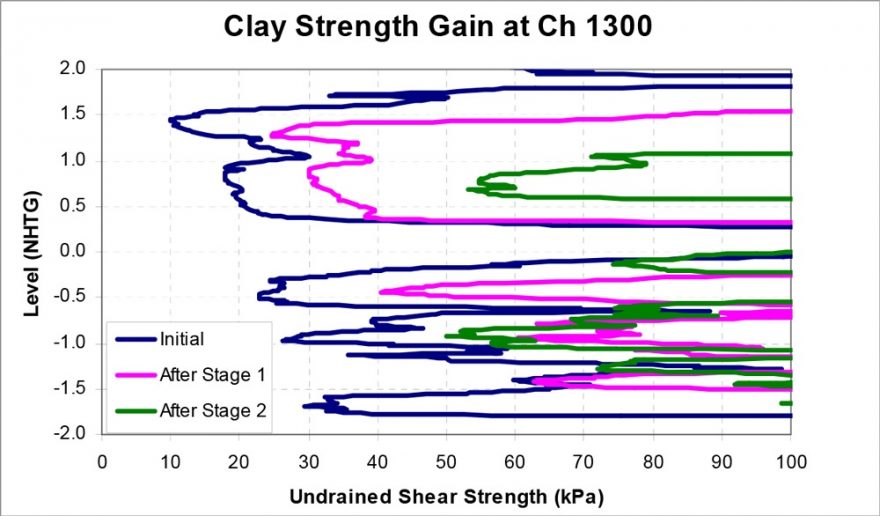
Figure 9: Strength Gain in Upper Clay from Preloading (Ch 1300, Reclaimer Berm)
5. Conclusions
The monitoring results indicated that the preload generally performed as predicted, with target settlement and strength criteria being met. Construction was completed without disruption to the existing coal handling infrastructure, and the facility has now been operating to expectations for about one and a half years. The success of the project has been attributed to the accurate and timely supply and analysis of monitoring results, together with good communication and liaison with all parties involved.
6. Acknowledgements
The author acknowledges the assistance and co-operation from Port Waratah Coal Services Limited (PWCS), and Bechtel Australia Pty Ltd. Several other members of the Douglas Partners team made significant contributions to the project, in particular Peter Will Wright, Chris Bozinovski and John Niland.
7. References
- Douglas Partners Pty Ltd, 2000, ‘Proposed Coal Stockyard, PWCS Stage 3 Expansion, Kooragang Coal Loader’, Unpublished report, Project 31100A, April 2000.
- Douglas Partners Pty Ltd, 2001, ‘Geotechnical Instrumentation Monitoring, PWCS Stage 3 Expansion, Kooragang Coal Loader’, Unpublished report, Project 31100B, June 2001.
Download the PDF here.

